Adding a tool to the platform
Log in to the QMENTA Platform and access the My Analysis menu. Then, click on Other Options and then My tools.
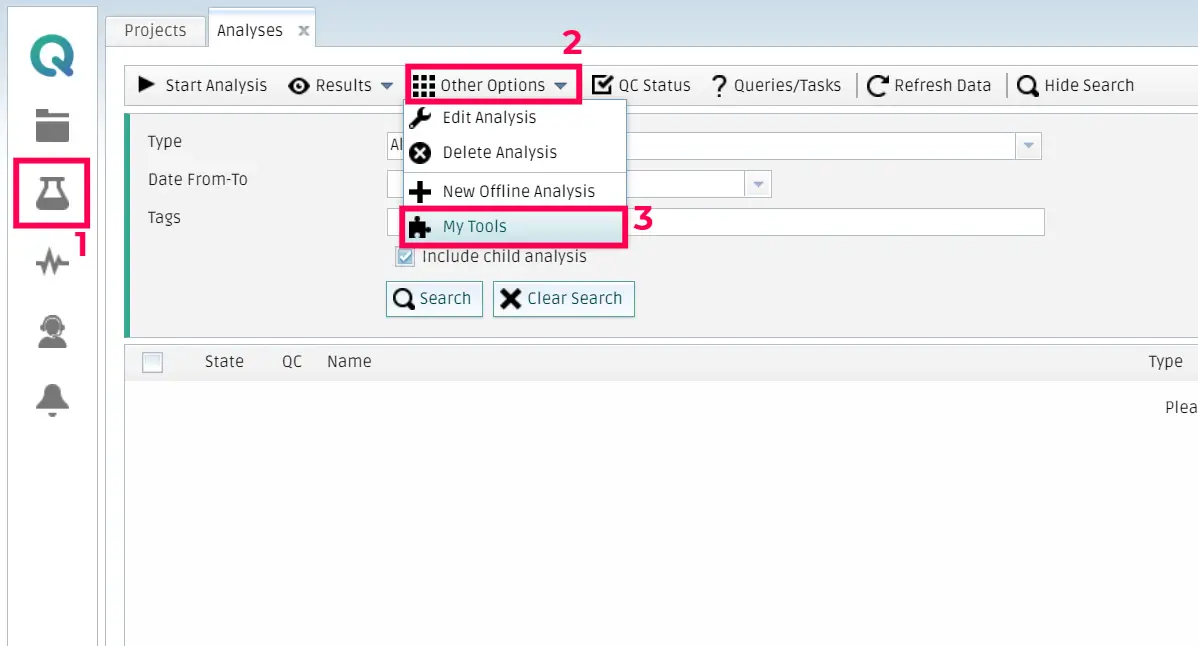
Once the form is visible, you should click on New tool.
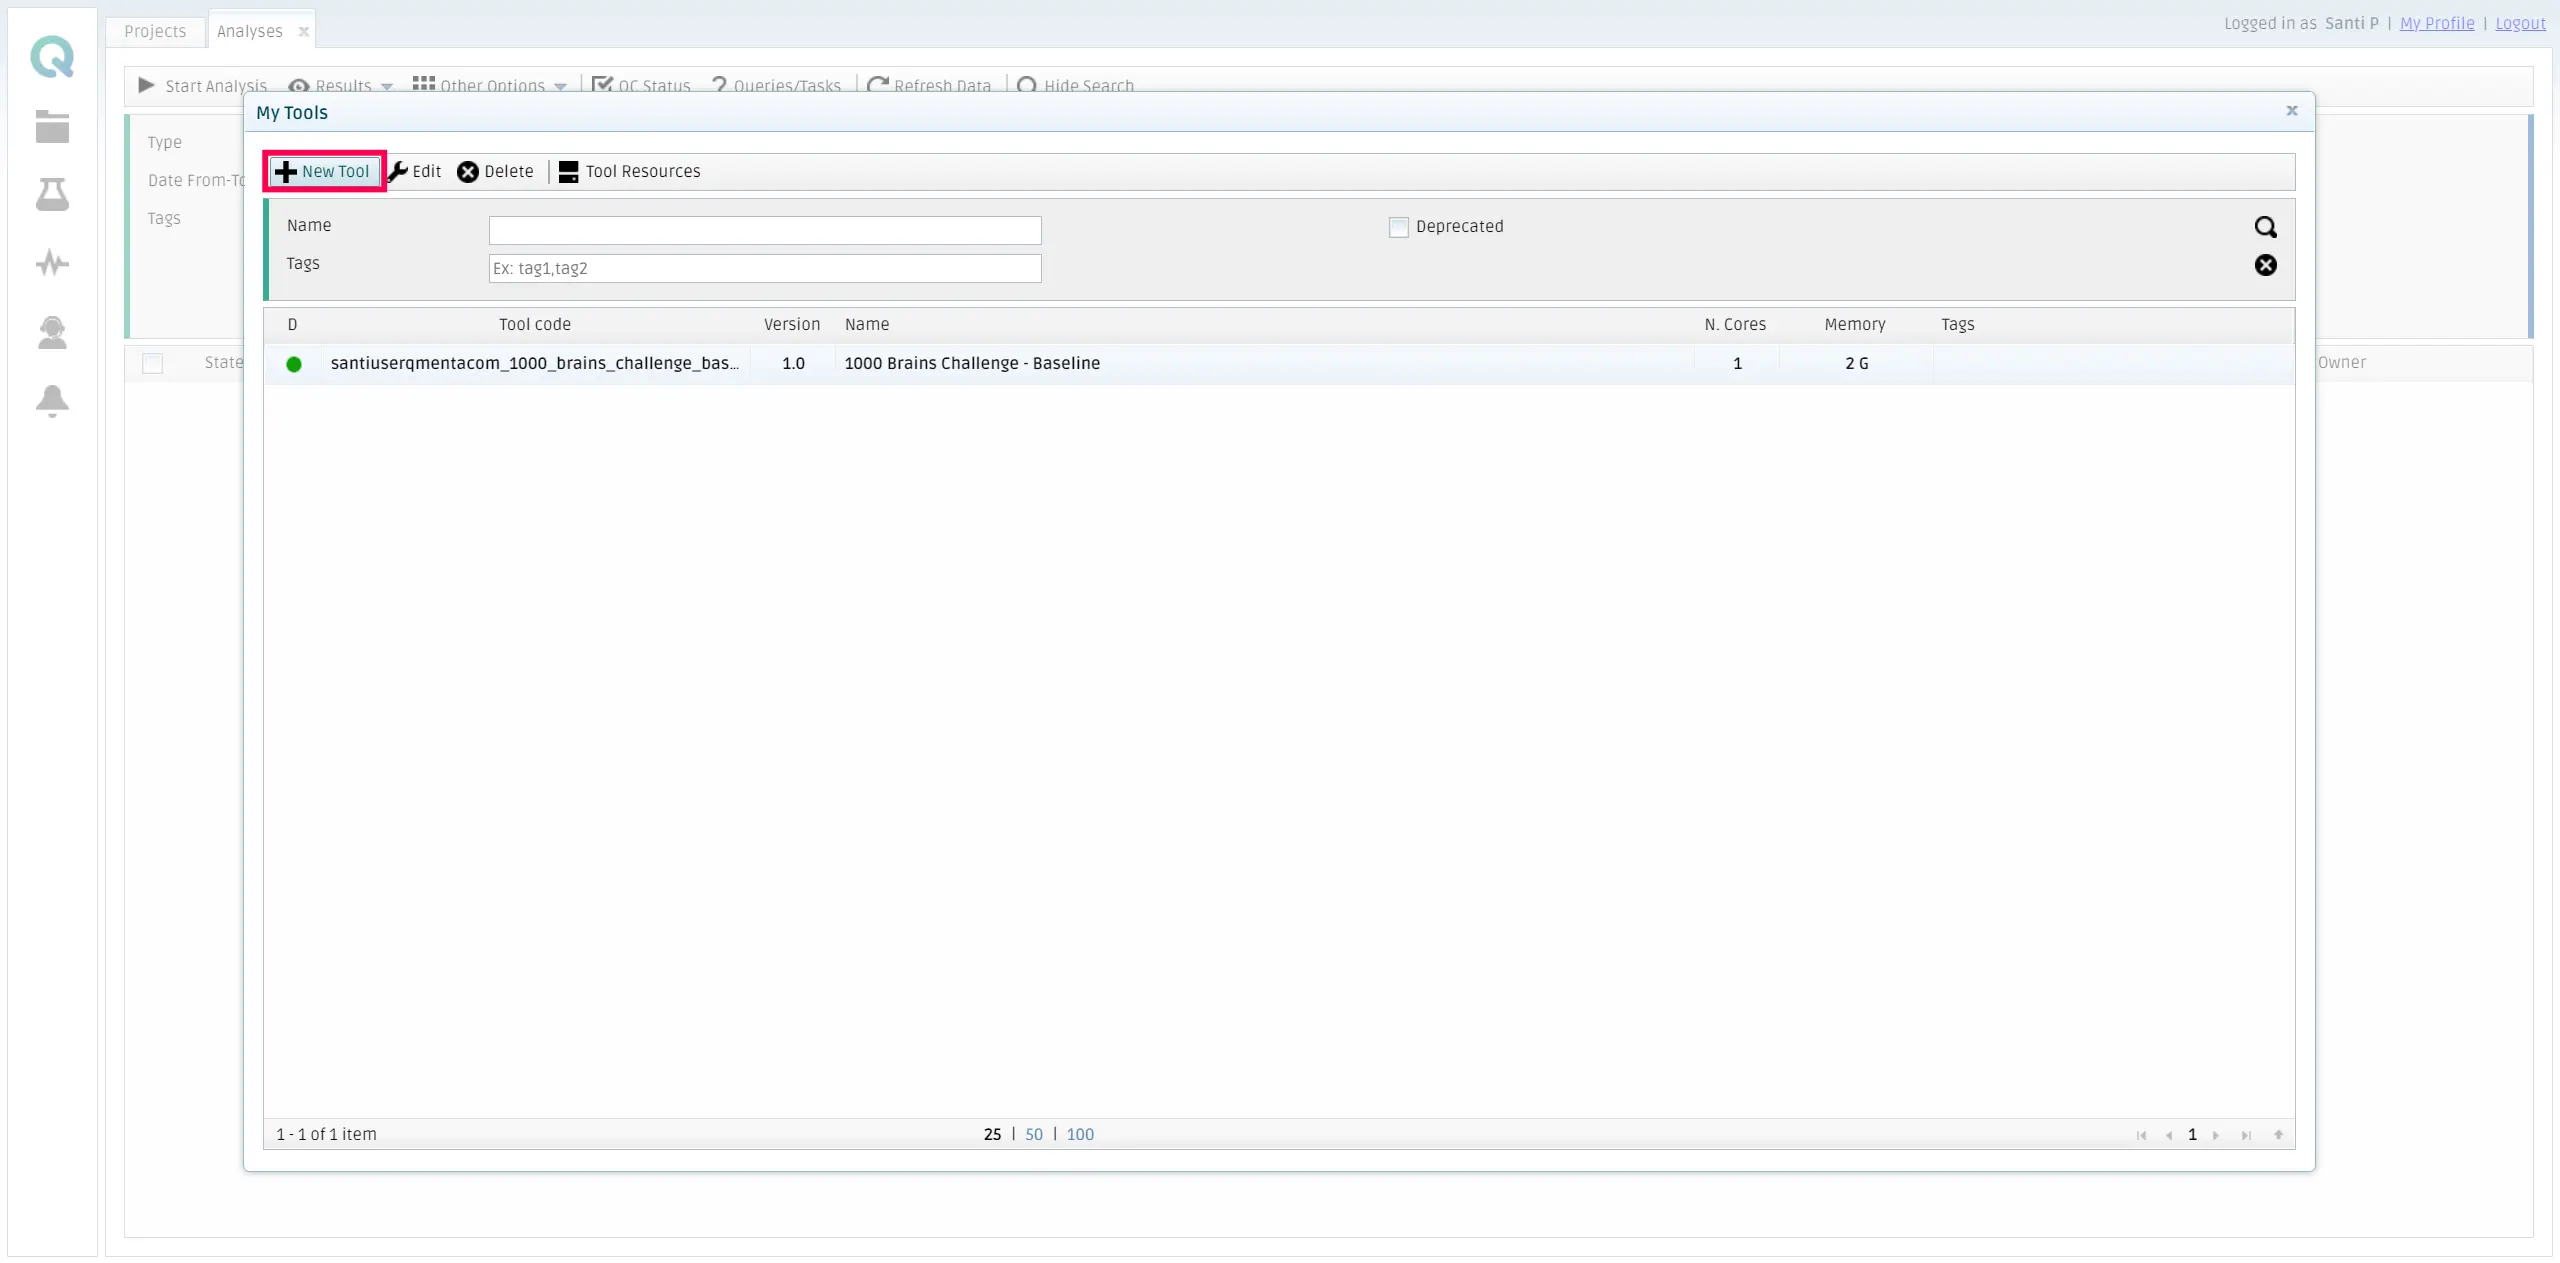
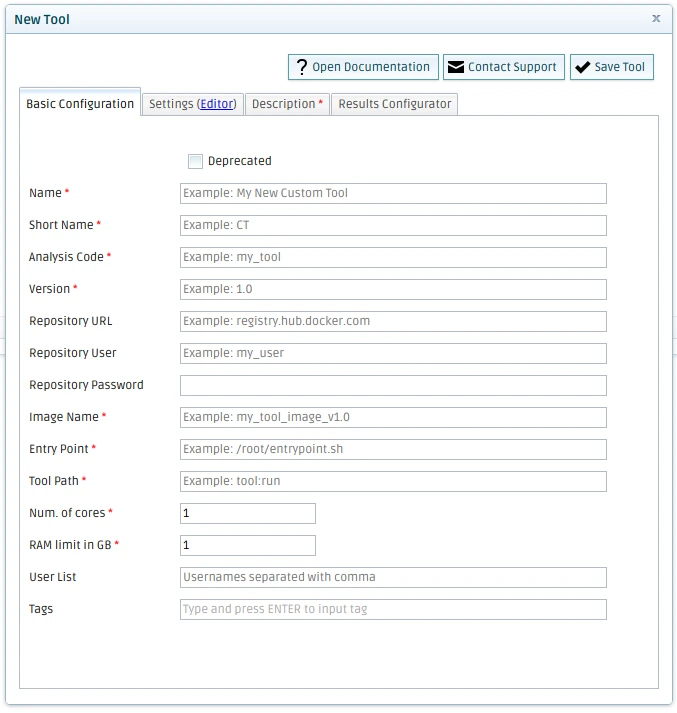
You can open the configuration dialog by clicking on New Tool or Edit Tool for existing tools. This dialog has several tabs that need to be filled appropriately in order to specify how the tool should be launched, interfaced and how its results should be shown to the end user.
Basic Configuration
Here you must specify the essential information of your tool, including IDs, Docker image and computing requirements.
- Name
The full name of your tool.
Example:
DL Morphology Analysis
- Short Name
A shorter name of your tool (used in tables and other narrow elements).
Example:
DLMA
- Analysis Code
The unique tool ID (without spaces or special characters). Your username will be automatically pre-appended to your analysis code (you do not have to worry about coinciding with other users’ tools).
Example:
dl_morphology_analysis_stable
- Version
Your version identifier. Typically, a MAJOR.MINOR which will not change. Even though you can update the Docker image later on, we recommend creating a new tool with a different MAJOR.MINOR if the Docker image has significant changes.
Example:
1.7
- Registry URL
The registry where your images (repositories) are stored.
Example:
registry.hub.docker.com
- Repository User
Your registry username.
Example:
janedoe
- Repository Password
Your registry password.
- Image Name
The full image name (username/tool_name:version_tag).
Example:
janedoe/dl_morph:1.7.21
- Entry Point
The sequence of commands run at start-up. See Extending the Entry Point for more information.
Example:
/root/entrypoint.sh
- Tool Path
The function name and method of the tool python script.
Example:
tool:run
- Num. of cores
The number of CPU cores allocated to the tool.
Example:
2
- RAM limit in GB
The amount of memory allocated to the tool. Please note that this is a hard limit. If the Docker container tries to allocate more memory it will be killed and the analysis will be reported as failed.
Example:
4
- User List (optional)
The usernames of the users you want to share the tool with.
Example:
johndoe@mail.com, jakedoe@mail.com
Settings
The settings tab can be used to define how the tool should be interfaced. If you use the default settings JSON definition, the tool will accept any kind of session regardless of its contents. Whilst this is useful during testing, we recommend that release-ready tools filter the input sessions they accept by using the file filter syntax.
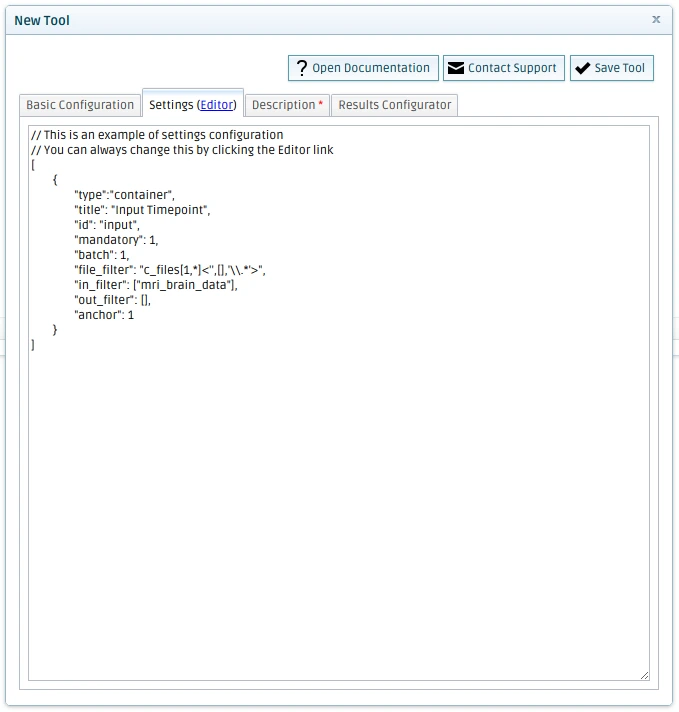
The settings JSON definition should include also any parameter you would like to expose to the users via the a graphical user interface.
For more information about the options available see Parameters and Input Files.
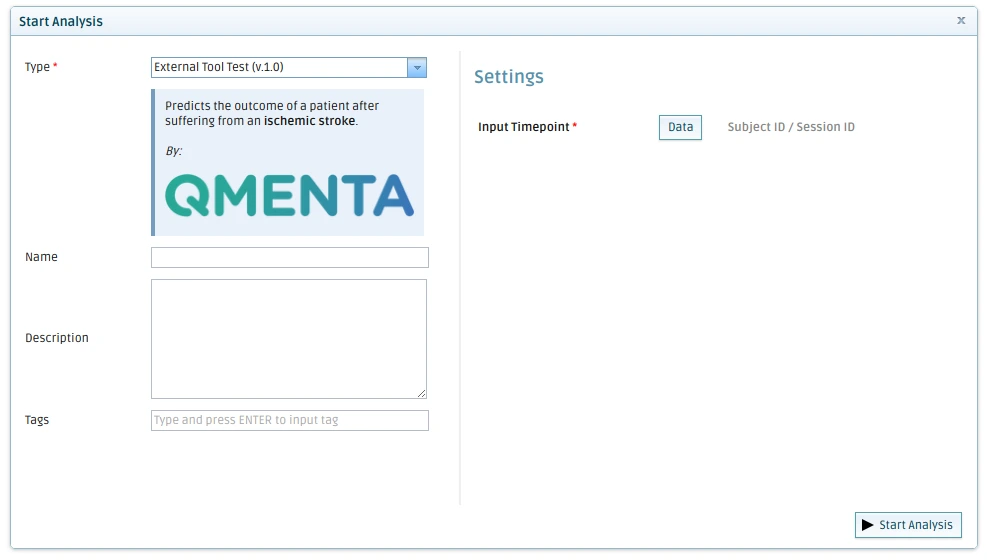
Description
A brief explanation on the purpose of the tool and any other relevant information you may want to share with the users. The description can be enhanced with HTML tags (you can use formatting elements and links).
Example:
Predicts the outcome of a patient after suffering from an <b>ischemic
stroke</b>.

<i>By:</i>

<img src="https://data.qmenta.com/images/QMENTA_logo.webp" width="100%"
alt="QMENTA"/>
Result:
Results Configurator
Note
This configuration is optional. If you do not define any special results visualization, a dialog with the list of results files will show instead.
When a tool finishes, its results can be visualized in three different ways:
List of results files: a dialog with all the files saved by the tool using the function upload_file of the SDK. The dialog allows users to visualize, download and edit the tags of the different results files.
PDF Report (optional): if the tool has saved a file named “report.pdf”, it will automatically be downloaded through your browser if the user clicks on the Get Report.
Customized results view (optional): configurable window with different widgets including but not limited to image viewers and HTML sections.
In the Results Configurator you can specify how you want the customized results view to be rendered.
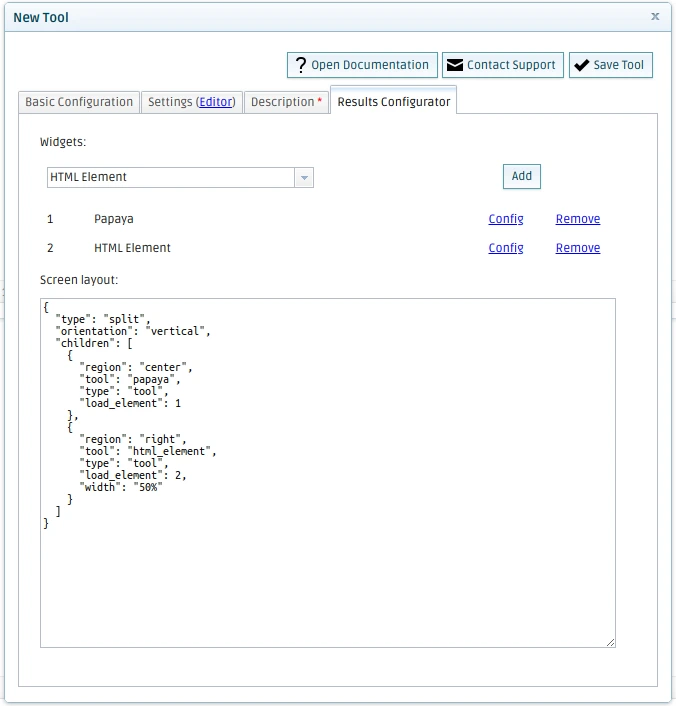
The results configurator has two sections: a list of widgets and the screen layout. In the list of widgets you can add, configure and remove the different sections you want to have in your results window. In the screen layout you can define how these widgets should be arranged.
Widgets
You can choose one of the widgets in the drop-down menu and click “Add” in order to add it to the list below the menu.
Types of widgets:
- Papaya:
papaya An open source medical image viewer that accepts NIfTI and DICOM files. Its configuration should include a title, the preferred visualization settings (use world/voxel space and radiological or default perspective), and the list of images to load in the viewer.
Each image is loaded in a different layer by specifying its file name, a matching modality, a matching tag or a regular expression matching the name of the file (or a combination of them).
You can also specify a preferred color mapping and a fixed minimum or maximum thresholds (the thresholds are automatically assigned depending on the contents of the image otherwise).
- Papaya:
Note
Please note that images needs to be saved as .nii.gz in order to be viewed in Papaya.
- HTML Element:
html_element An HTML snippet. You can include text, images and links to any additional material you want to provide.
- HTML Element:
- HTML File Inject:
html_inject Similar to the HTML Element. But in this case, the HTML content is loaded from the results of the tool instead of being static. You need to specify the full name of the html file to load.
- HTML File Inject:
- TRK Viewer:
tractography A viewer for .trk files. Requires the full name of the file to load.
- TRK Viewer:
- Connectome Viewer:
connectome A connectivity matrix visualizer compatible with .csv files. Requires the full name of the file to load.
- Connectome Viewer:
- Action Block:
action_block Trigger actions depending on predefined conditions.
By default, it can be used to enforce a manual quality control over the results of an analysis. For instance, you can define an Action Block where a quality control question is asked to the user, and then add two options (YES and NO) which would set the QA status of the analysis to pass or fail respectively.
If you need any other special trigger, please contact us.
- Action Block:
Note
Both the HTML Element and the HTML File Inject can load files and images from the list of tool results. The source of the images is defined as the absolute path of the output container file.
However, you can use the special tag imageSelector for showing any
number of images (a kind of group selector):
t: A list of tags that the image must contain
r: regular expression matching the name of the image
w: the width of the image (can be in percentage)
a: alignment of the images. br for break between images; float for having the images next to each other
m: margin of the images. Example 5px
In the following example, you can see a a simple png image pointing to one of the files produced by the tool, and a couple of more advanced images where the special tag imageSelector is used.
Example:
<img src="img_output.webp" style="width:50%"/>
<imageSelector t='' r='values_maxim(.*)\.webp' w='60%' a='float'
m='20px'>
<imageSelector t='' r='(.*)\_hist.webp' w='60%' a='float' m='20px'>
Screen layout
Here you can specify the arrangement of the widgets with JSON text that needs to point to the different elements specified in the in widgets list (in order).
Each widget can define the following properties:
- type
Widgets have the type
tool.
- tool
The type of the widget:
papaya,html_element,html_inject,tractography,connectome,action_block.
- load_element
Integer that identifies the widget.
- region
Location of the element in the screen. One of:
right,left,center,top,bottom.
- width (optional)
Width of the element, specified as a percentage of available canvas space.
- height (optional)
Height of the element, specified as a percentage of available canvas space.
Example:
{
    "type": "tool",
    "tool": "html_element",
    "load_element": 1,
    "region": "left",
    "width": "50%"
}
The widgets can be positioned with a simple list or using one of the layout elements described next:
- List
Display the different widgets one after the other.
Example:
[
    {
        "type": "tool",
        "tool": "html_element",
        "load_element": 1,
        "region": "left"
    },
    {
        "type": "tool",
        "tool": "papaya",
        "load_element": 2
    }
]
- Split
Divide the window in columns or rows using
"horizontal"or"vertical"orientation respectively.Note
When definining an
horizontalsplit, region must be defined asleft,rightorcenterand the children elements must specify awidth.By the same token, the region of
verticalsplits must betop,centerorbottomand the children elements must specify aheight.Example:
{
    "type": "split",
    "orientation": "vertical",
    "region": "left",
    "children": [
        {
            "type": "tool",
            "tool": "html_element",
            "load_element": 1,
            "region": "left",
            "width": "50%"
        },
        {
            "type": "tool",
            "tool": "papaya",
            "load_element": 2,
            "width": "50%"
        }
    ]
}
- Tabs
Separates different widgets using distinct tabs toggled via labeled buttons (widgets must define
button_label).Example:
{
    "type": "tab",
    "children": [
        {
            "button_label": "Plots",
            "type": "tool",
            "tool": "html_element",
            "load_element": 1
        },
        {
            "button_label": "Labels",
            "type": "tool",
            "tool": "papaya",
            "load_element": 2
        }
    ]
}
Tip
The layout elements (list, split and tabs) can be combined to define more complex arrangements.
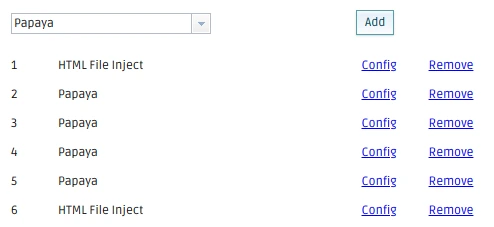
Complete Example
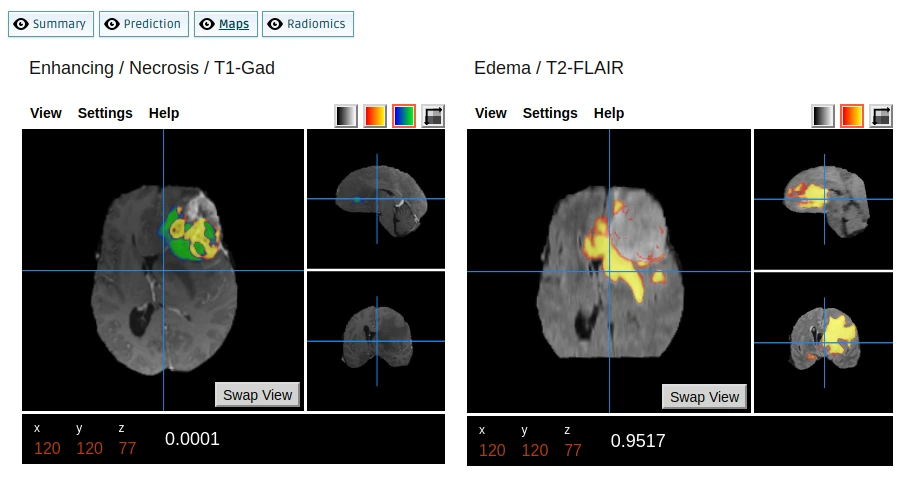
The following widget list and screen layout configuration defines 4 tabs (Summary, Prediction, Maps and Radiomics). The first and last tabs load an html from the tool whilst the second and third tabs show two images with Papaya using a split layout element (see image).
Widgets List
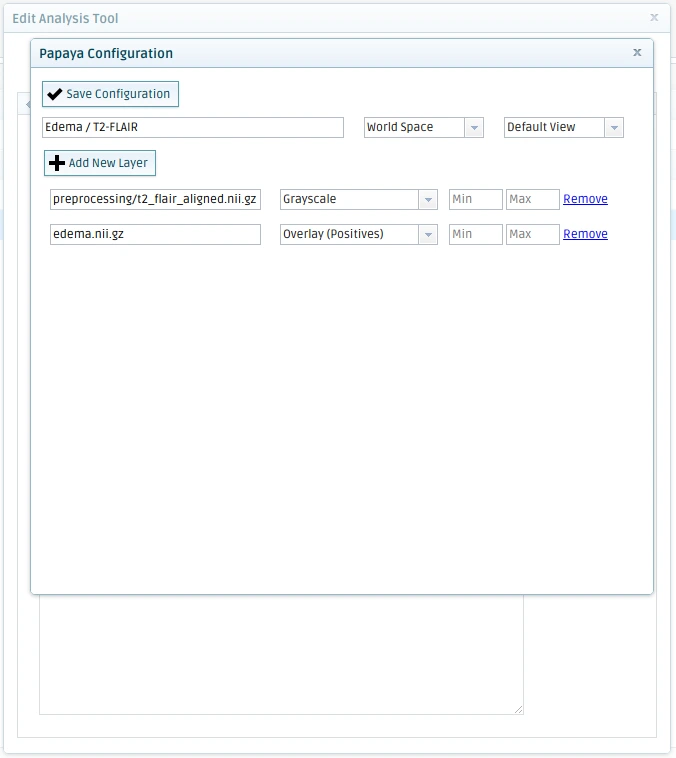
Papaya Widget Config
As example, we should the Papaya element 4, which loads two NIfTI images from the output files of the tool (base image and overlay) using different color maps.
Layout
{
    "type": "tab",
    "children": [
        {
            "button_label": "Summary",
            "type": "tool",
            "tool": "html_inject",
            "load_element": 1,
            "region": "center"
        },
        {
            "button_label": "Prediction",
            "type": "split",
            "orientation": "vertical",
            "children": [
                {
                    "type": "tool",
                    "tool": "papaya",
                    "load_element": 2,
                    "region": "center"
                },
                {
                    "type": "tool",
                    "tool": "papaya",
                    "load_element": 3,
                    "region": "right",
                    "width": "49%"
                }
            ]
        },
        {
            "button_label": "Maps",
            "type": "split",
            "orientation": "vertical",
            "children": [
                {
                    "type": "tool",
                    "tool": "papaya",
                    "load_element": 4,
                    "region": "right",
                    "width": "49%"
                },
                {
                    "type": "tool",
                    "tool": "papaya",
                    "load_element": 5,
                    "region": "center"
                }
            ]
        },
        {
            "button_label": "Radiomics",
            "type": "tool",
            "tool": "html_inject",
            "load_element": 6,
            "region": "center"
        }
    ]
}
Result